Description of the ExtRaINSIGHT method
A brief outline:
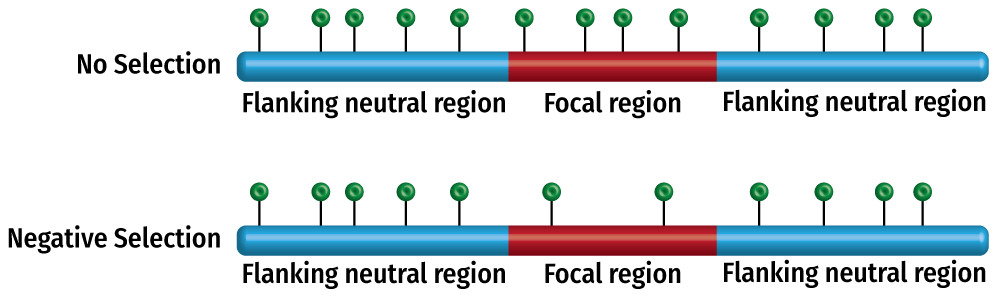
ExtRaINSIGHT uses the density of ultra-rare variants to measure intolerance to heterozygous variation for a given region. Because they are ultra-rare, these variants are incredibly unlikely to be present in both copies for any given individual. Thus, when a set of sites is depleted for rare variants (relative to expectation), it can be inferred that selection against even heterozygous variants is strong enough to remove them from the population (see figure above). ExtRaINSIGHT uses a contextual model for the expected number of rare variants based on neutral sites and compares the expectation from that model to the number of observed rare variants for a second set of sites. The primary output of ExtRaINSIGHT is λs, the fraction of sites in which heterozygotes are under strong negative selection.The output files:
Running ExtRaINSIGHT produces several files which are detailed here:- ExtRaINSIGHT_{genome_version}.bed - The set of sites that ExtRaINSIGHT was run on (after subsampling and filtering)
- ExtRaINSIGHT_lambda_estimate.txt - Contains the estimated values from the ExtRaINSIGHT model. Key values are described below:
- strong_selection : λs
- p : the p-value for the null hypothesis that λs =0
- se : standard error for the estimate of λs derived from the curvature estimate
- INSIGHT_{genome_version}.bed - The set of sites that INSIGHT2 was run on (after subsampling and filtering)
- INSIGHT_{genome_version}.insres - The initialization values supplied to the INSIGHT2 model
- INSIGHT_{genome_version}.model - The fitted values of the INSIGHT2 model. You probably want the “RHO” value under “PARAMETERS”. The standard errors can be found under “UNCERTAINTY”. See the INSIGHT2 paper for more details.
A bit more detail:
ExtRaINSIGHT detects systematic variation in the density of rare variation for a given set of genomic regions compared to a neutral background. The human variation data comes from the gnomAD data aggregator2 and variants with MAF ≤ 0.001 are extracted (minus CpG sites and those with an average sequencing coverage ≤ 20). To calibrate ExtRaINSIGHT we use a set of neutral regions for which we used the set we defined for the INSIGHT3 method, using liftOver4 to convert to hg38. Finally, we constructed a set of features per allele at every site in the genome to be used in the mutation model. There were four features in the mutation model: frequency of each possible mutation given the 7-mer context in neutral regions, the log sequencing coverage, percent GC content in a 200bp window centered on the variant, and whether the SNP was in a CpG island. We subsampled 1% of mutations in these neutral regions and fit a logistic model to create a global model of rare-variant probabilities absent selection. To adjust for local factors that cause variation the in mutation rate (e.g. replication timing and recombination rate, cite), we tiled the genome into 50kb bins, then used the neutral variants per focal tile and flanking tiles with the mutation probability predicted from the global model as the only feature (plus an intercept) to produce a locally adjusted estimate of the mutation rate per variant.Given any collection of sites we then detect deviations from the neutral mutation model by fitting this binomial likelihood model:
\begin{equation*} L(\lambda ; Y,P ) =\prod_{i} (\lambda P_i)^{Y_i} (1-\lambda P_i)^{1-Y_i} \end{equation*}
where λ is the scale factor that captures a depletion of rare genetic variation making 1- λ the strength of negative selection (also referred to as λs). Pi is the neutral mutation probability for mutation i from the database of locally adjusted mutation rates and Yi is an indicator variable for the presence of mutation i in the sample. We then compute both a standard error using the curvature of the likelihood surface and a p-value using a likelihood ratio test with the null hypothesis that the focal regions are not depleted for rare variation(λs = 0).References:
1. Karczewski, K. J. et al. The mutational constraint spectrum quantified from variation in 141,456 humans. Nature 581, 434–443 (2020).2. Gronau, I., Arbiza, L., Mohammed, J. & Siepel, A. Inference of Natural Selection from Interspersed Genomic Elements Based on Polymorphism and Divergence. Mol. Biol. Evol. 30, 1159–1171 (2013).
3. Hinrichs, A. S. et al. The UCSC Genome Browser Database: update 2006. Nucleic Acids Res. 34, D590–D598 (2006).
4. Gulko, B. & Siepel, A. An evolutionary framework for measuring epigenomic information and estimating cell-type-specific fitness consequences. Nat. Genet. 51, 335 (2019).