Progress
6/16/2011
Below is a quick summary of the conservation and nucleotide substitution results so far. It shows the results for 295 miRNAs with all confidently annotated orthologs.
Conservation
Cumulative analysis of all miRNAs
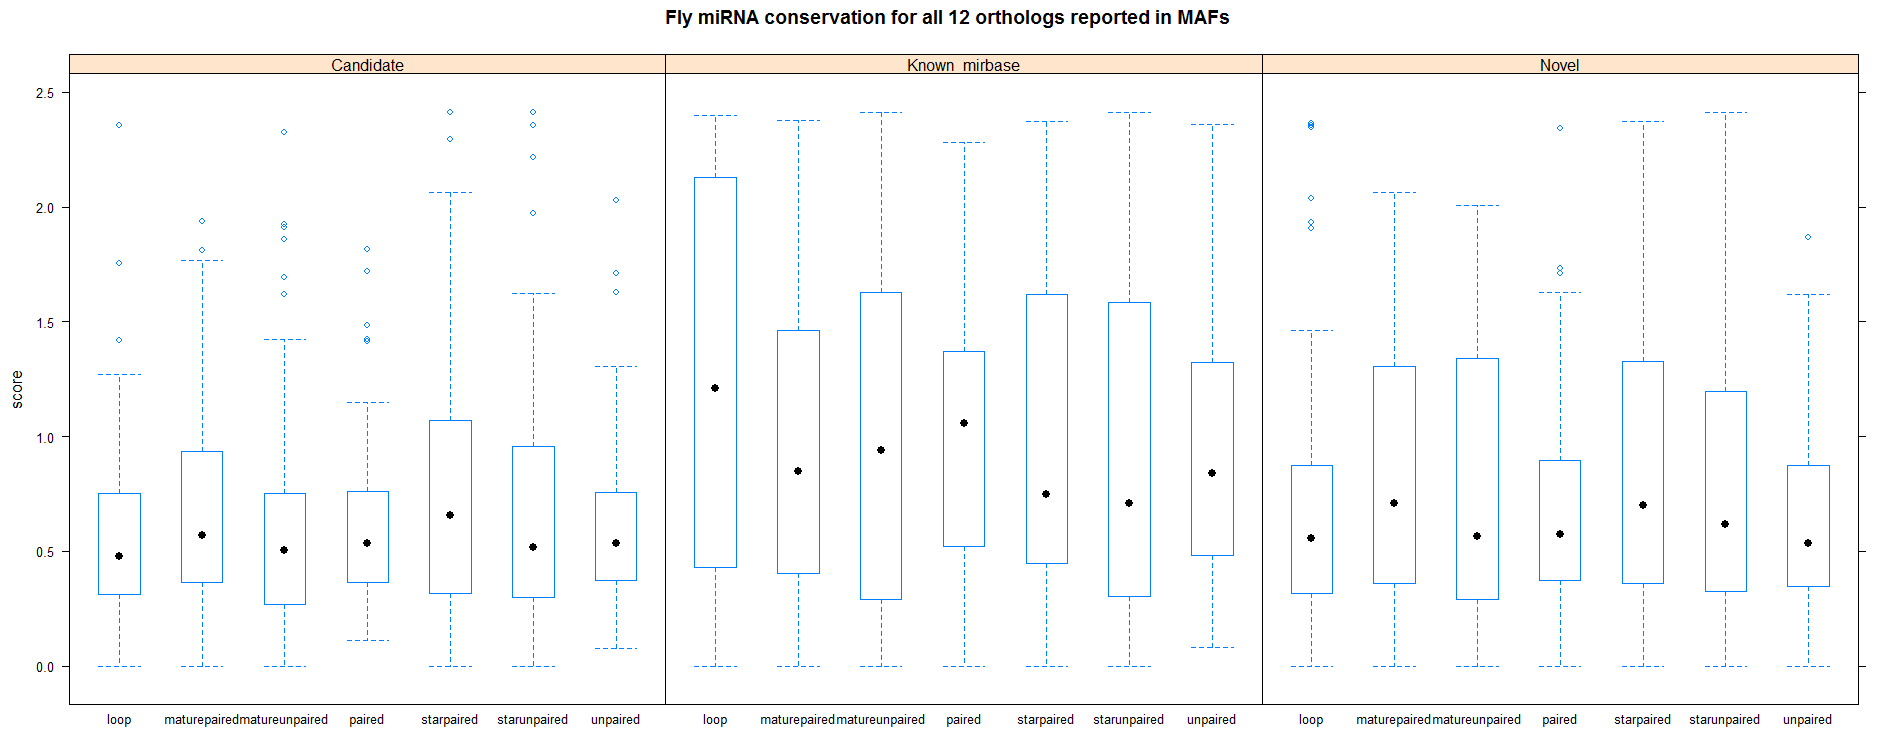
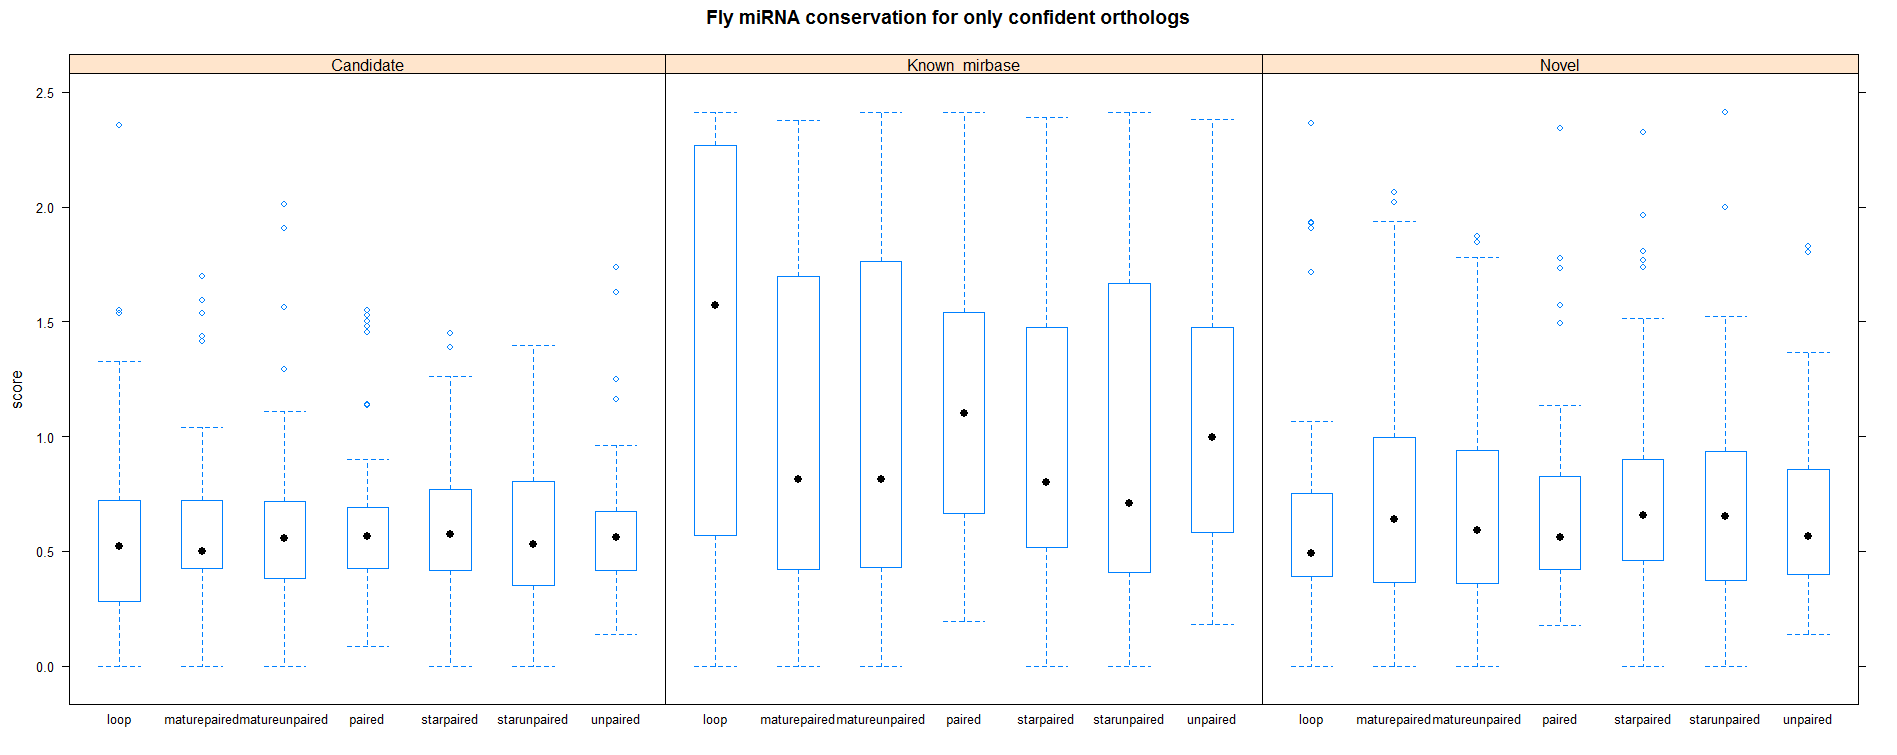
Plot of conservation by miRNA class
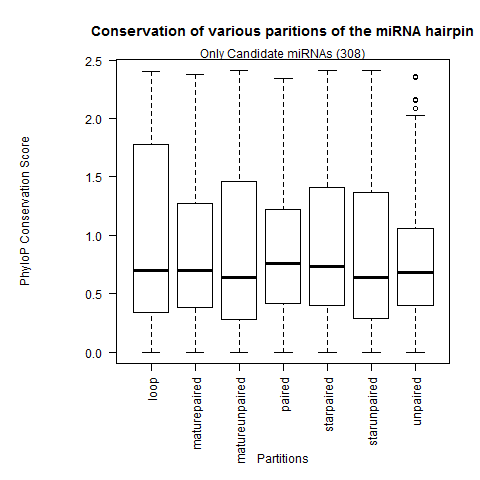
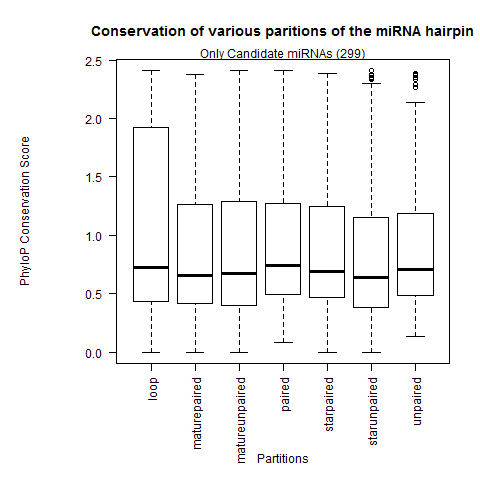
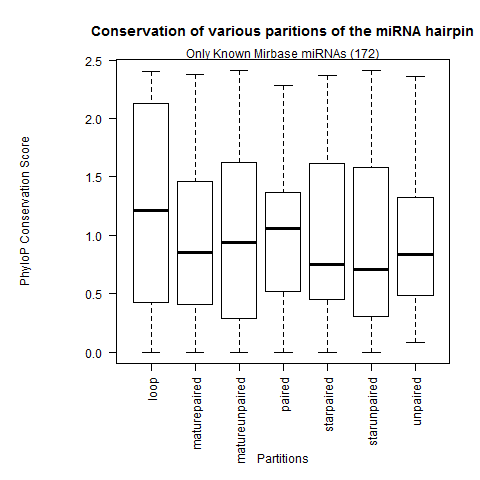
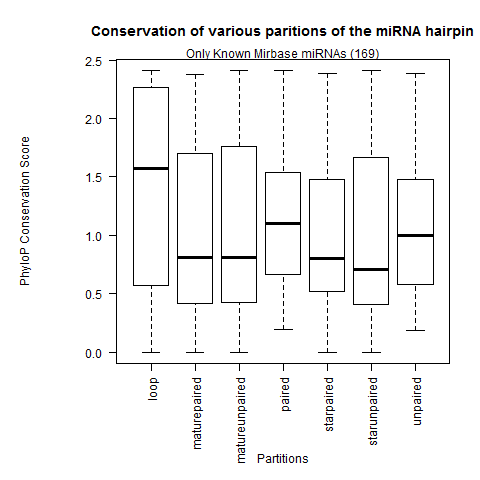
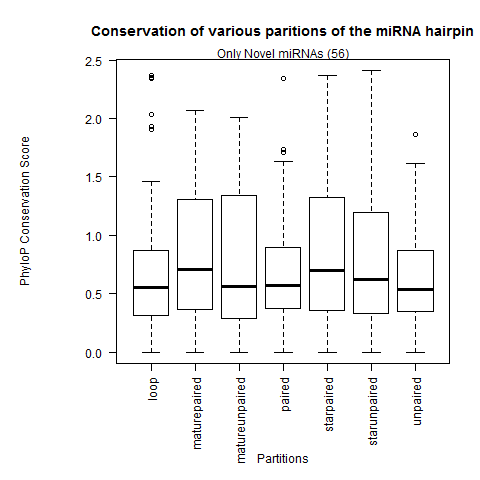
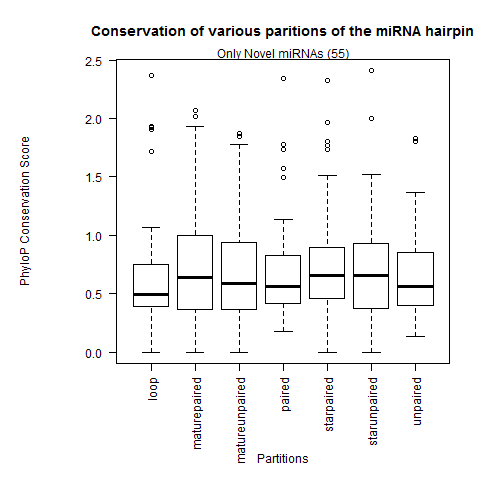
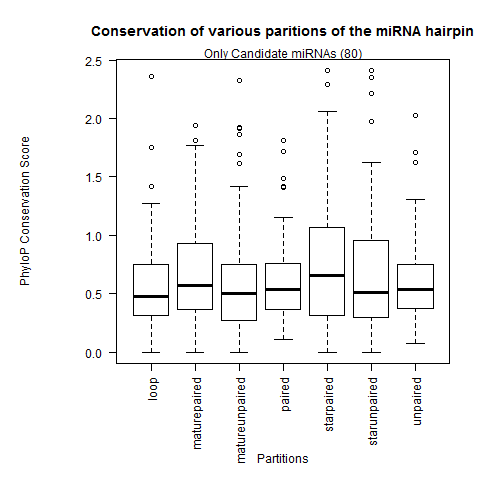
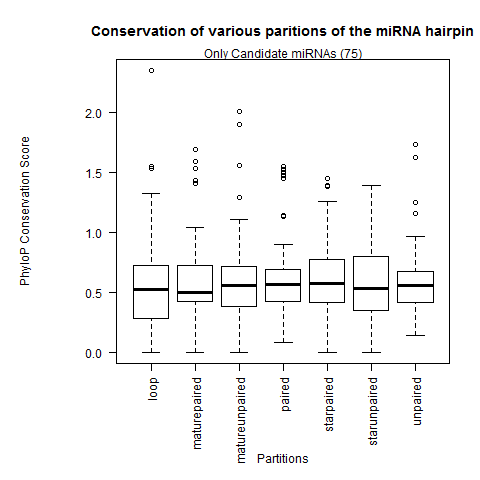
Plot of conservation by miRNA hairpin partition
Key points:
- Mirtrons are the weakest conserved miRNA class. This has actually been suggested in numerous papers from the Lai lab. Their conservation pattern is actually not too different from non-functional intergenic regions, which evolve neutrally or acceleratedly.
- The intronic and intergenic miRNAs are deeply conserved, even more so than CDS regions.
- Confirmation that the loop partition is the weakest conserved than the rest of the hairpin partitions.
- The paired sites of the hairpin are the most conserved. In greater depth, we see the mature miR paired sites are the strongest conserved followed by the miR* paired sites and lastly the paired sites outside the duplex. This contradicts Clark 2007 where they observed the unpaired miR sites were the most conserved.
Deeper conservation investigation
In order to understand at a finer level the specific patterns of conservation, I decided to slice the results shown in the plots above by two criteria.
- miRNAs binned by number of species (or orthologs) present in their alignment.
- miRNAs of each class (i.e. mirtron, intronic, intergenic, etc.).
Finally, I decided to partition the data into two confidence buckets:
- removing candidate loci, thus leaving known (miRBase) and novel miRNAs in the analysis.
- keep all miRNAs but removing the non-hairpin-forming orthologs.
Firstly, let's examine the results partitioned by ortholog count and miRNA class:
Analysis broken down by number of orthologs present for each hairpin partition
Analysis broken down by number of orthologs present for each miRNA class
Analysis broken down by types of miRNA for each hairpin partition
Key points:
- As the number of species present in the alignment increases (i.e. ortholog count increases), the conservation is increased. This is true because there is more evidence to support higher conservation if more species exists.
- With greater than 16 species present, we see that mirtrons (and tailed-mirtrons) have the least conservation score. However this trend is not observed in smaller alignments. For example, with 12 species present, we see that mirtrons have a higher averaged conservation score than integenic miRNAs.
- The integenic and intronic miRNAs have the same hairpin partition conservation trends as mentioned above. That is, loop is the lowest conserved partition followed by unpaired and paired regions outside the duplex and finally, the unpaired and paired regions of the duplex have the highest conservation score. However this trend is not observed for the CDS miRNAs, which appear to have uniform conservation throughout the hairpin indicative that CDS miRNAs are not structurally constrained in their evolution and may have evolved into hairpin structures by chance.
Next, the conservation analysis done by looking at non-candidate miRNAs as well as only hairpin-forming orthologs did not change significantly than that above. If you'd like to convince yourself, here are some of the plots:
Plotting only Known and Novel miRNAs (excludes candidate loci)
Plotting all miRNAs but only hairpin
orthologs
Substitution
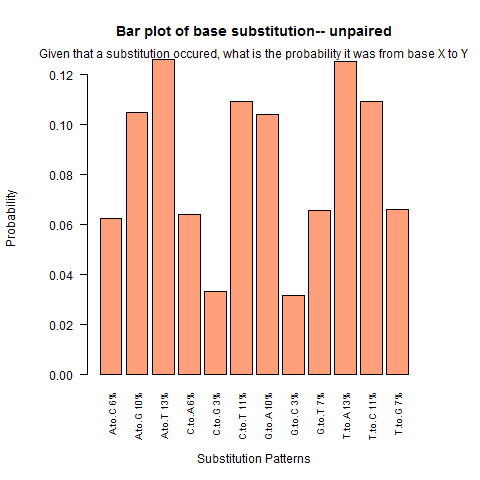
Similar to conservation, I also chose to investigate the nucleotide substitutions across various partitions of the miRNA hairpin as well as investigate the patterns across various miRNA classes.
Plot of substitutions by miRNA class
Substitutions patterns of mirtron vs. intergenic & intronic miRNAs
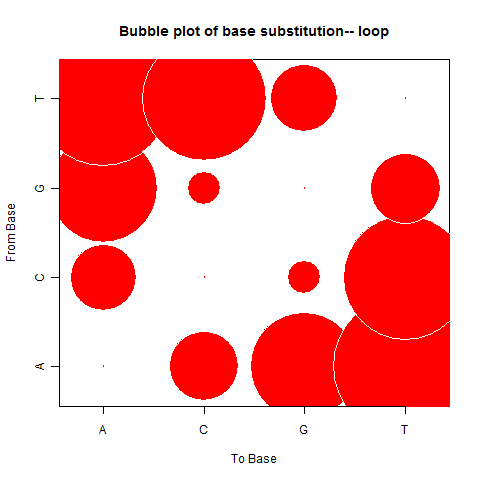
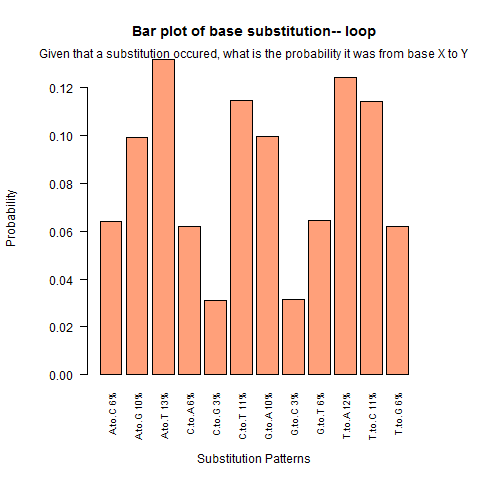
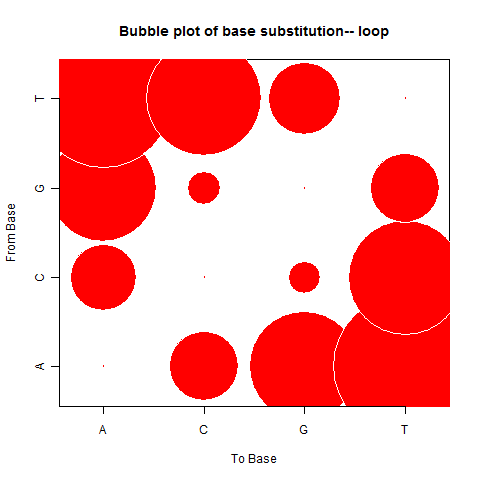
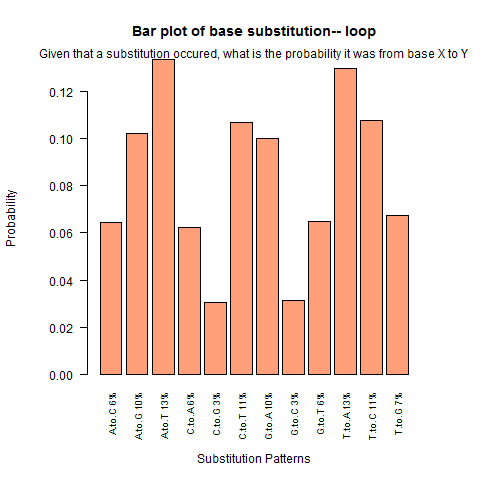
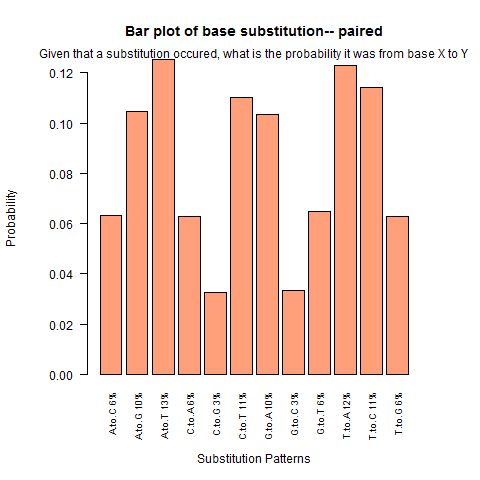
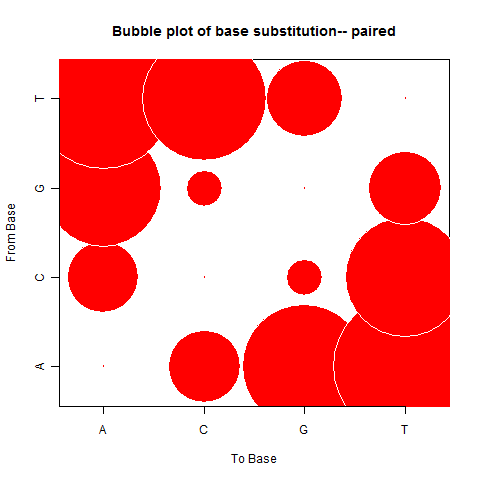
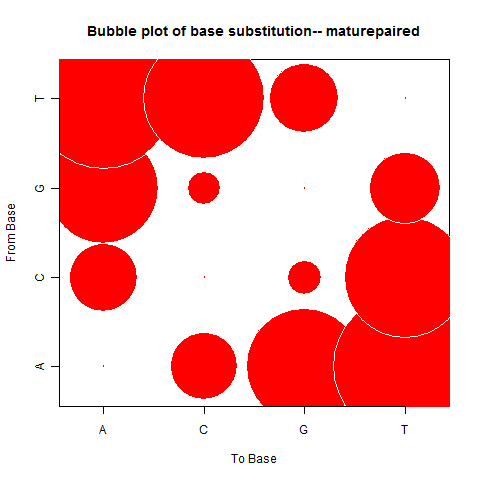
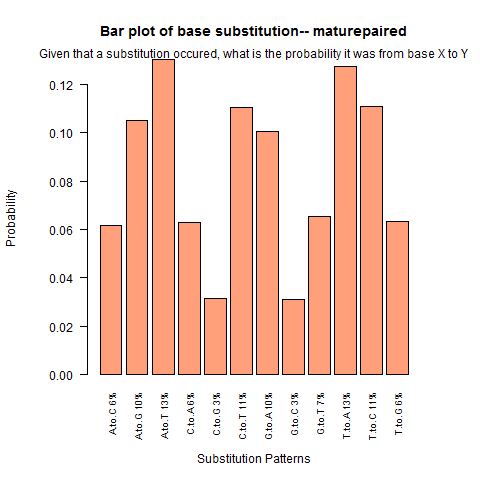
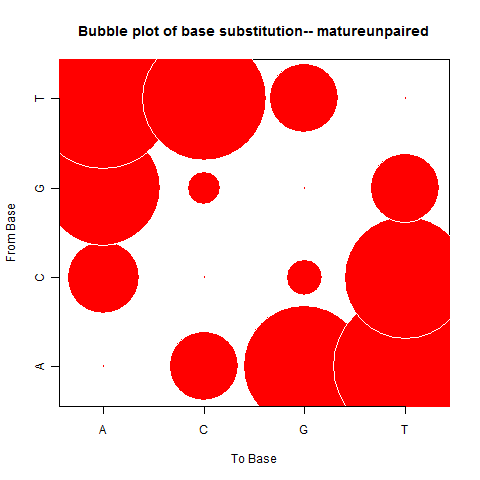
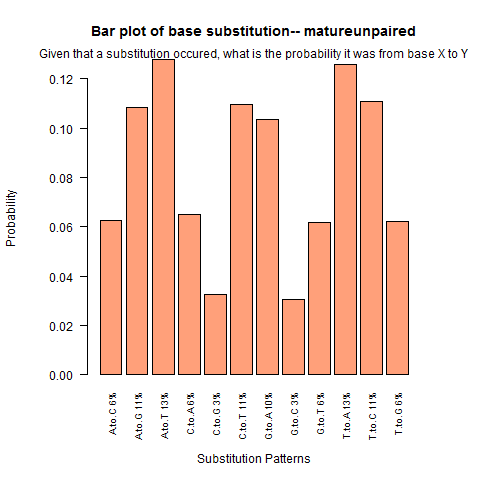
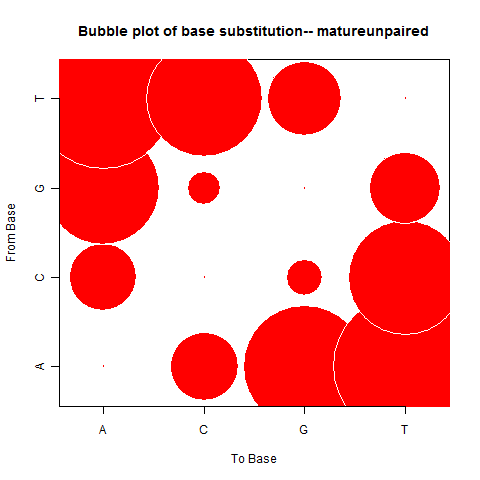
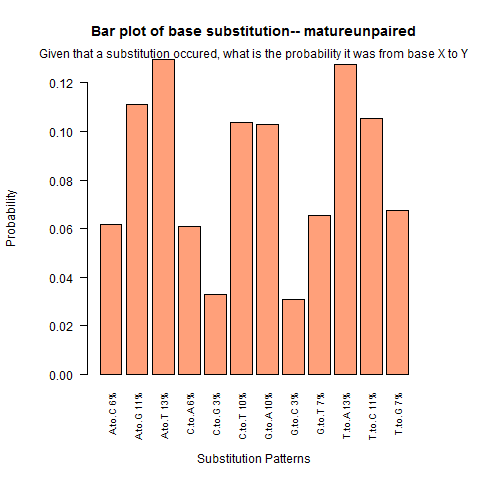
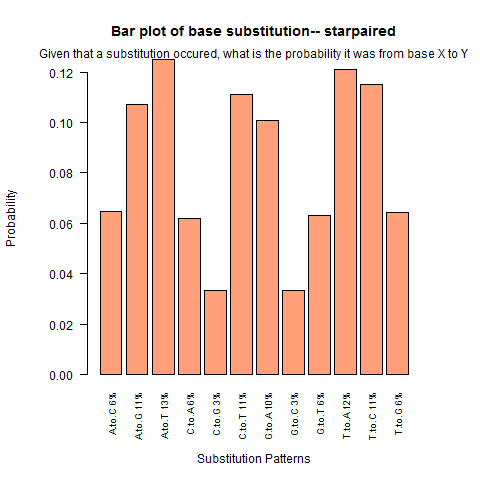
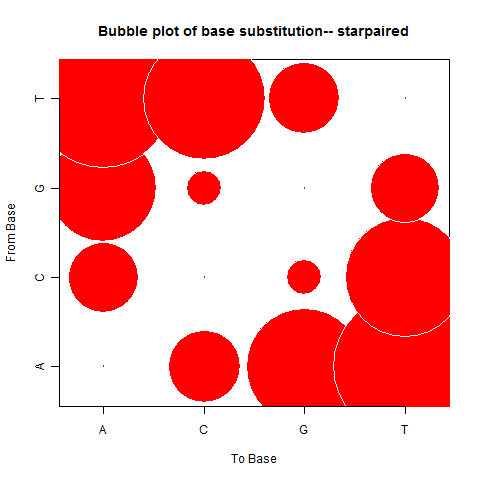
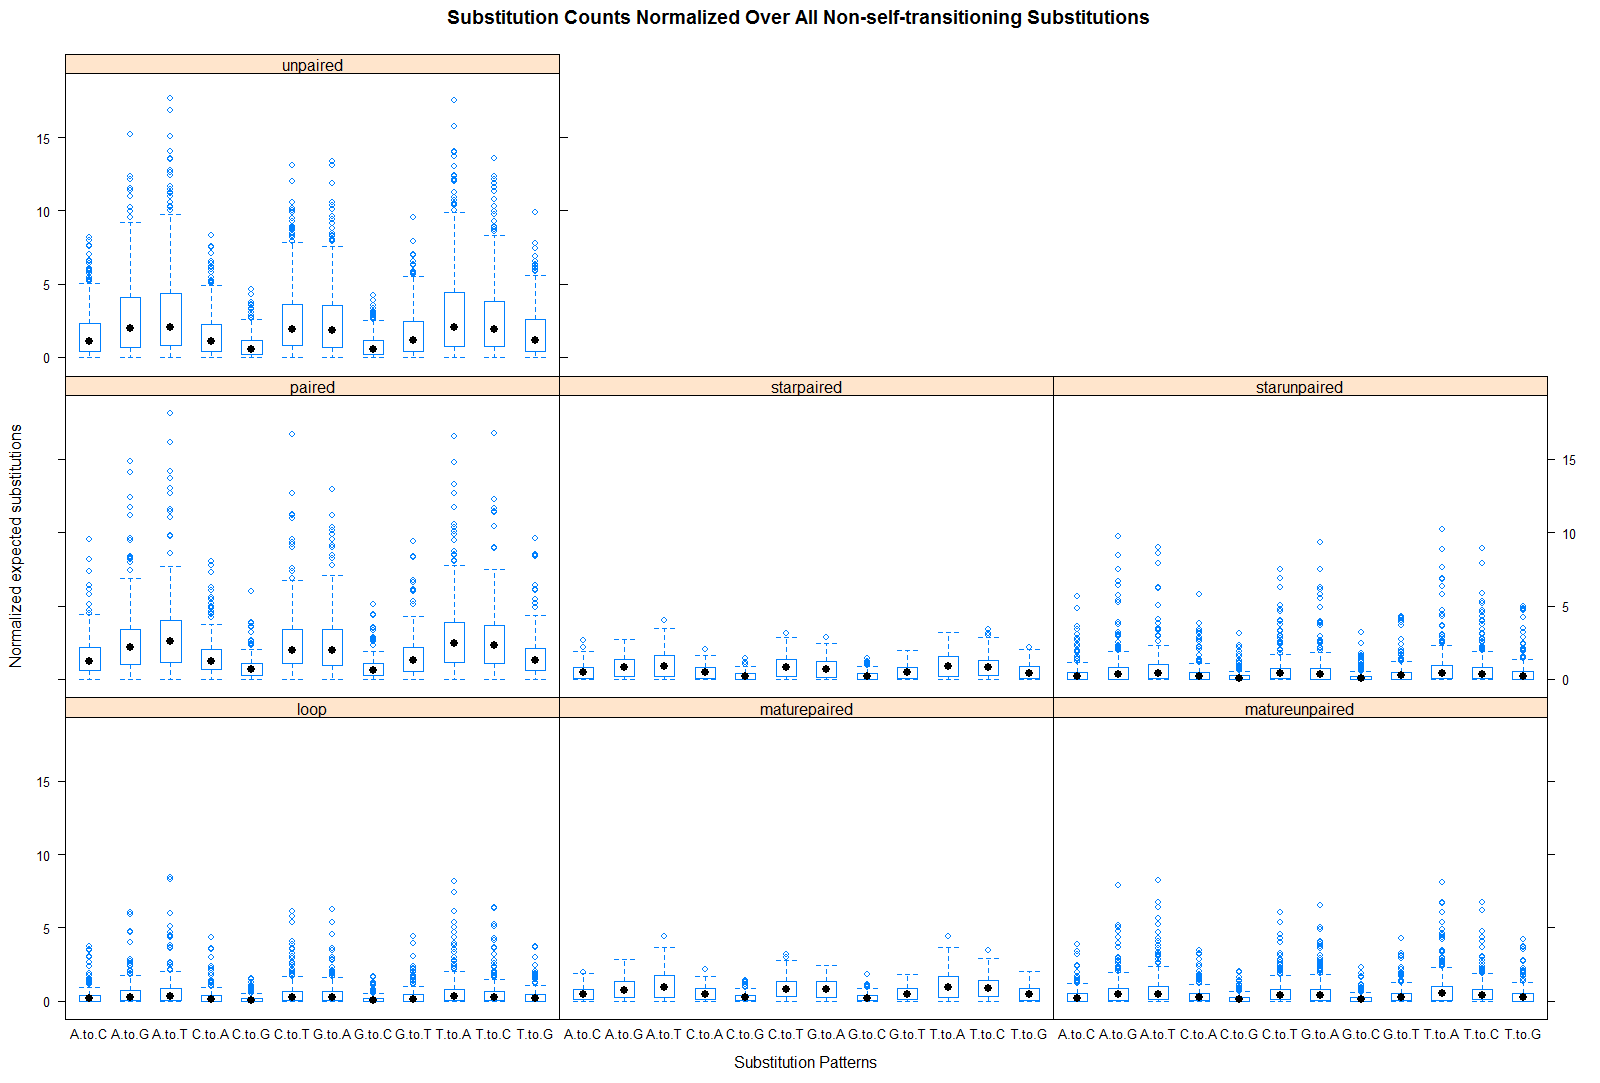
Plot of substitutions by miRNA hairpin partition
Key Points:
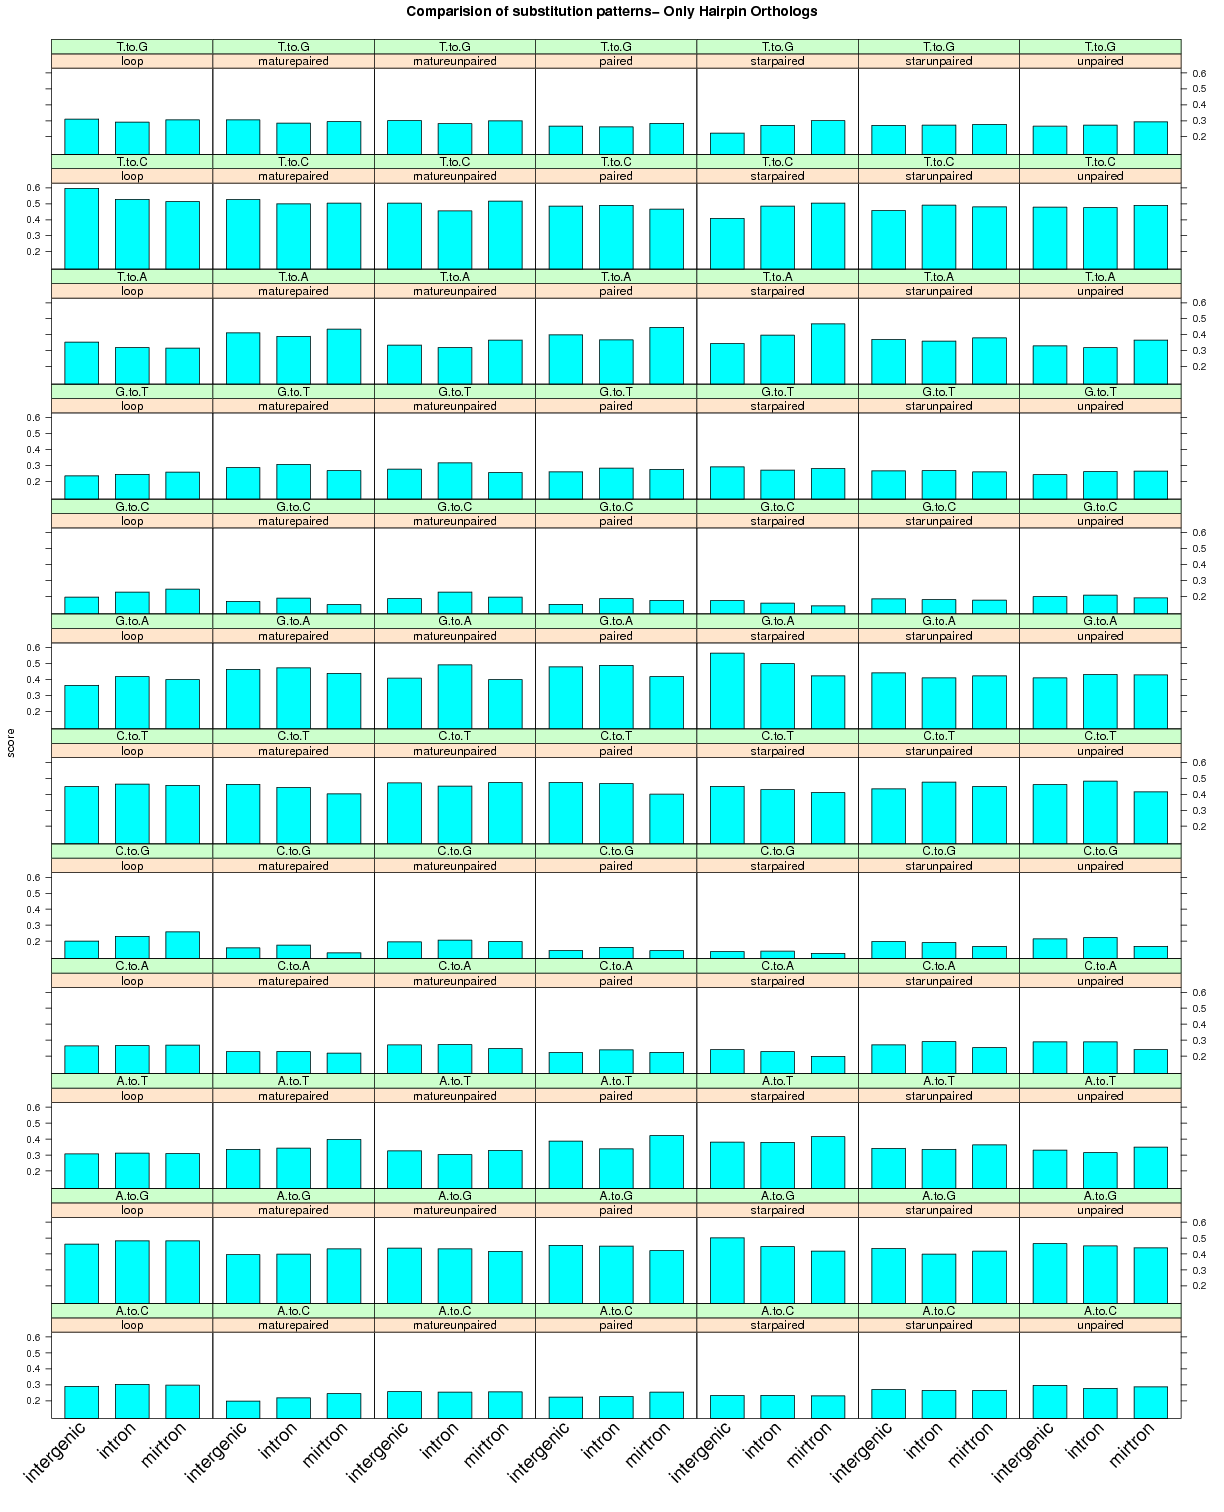
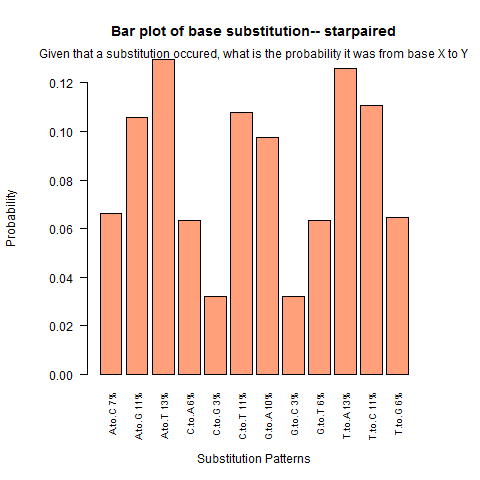
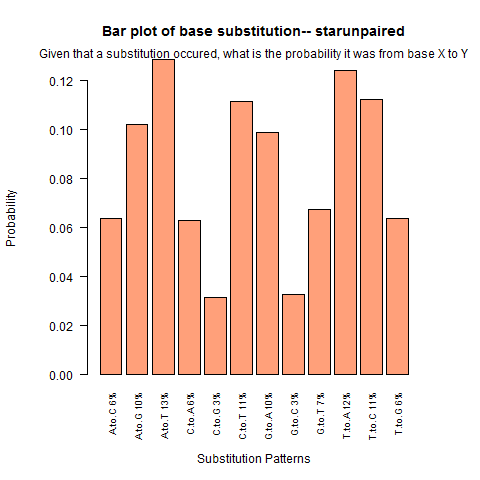
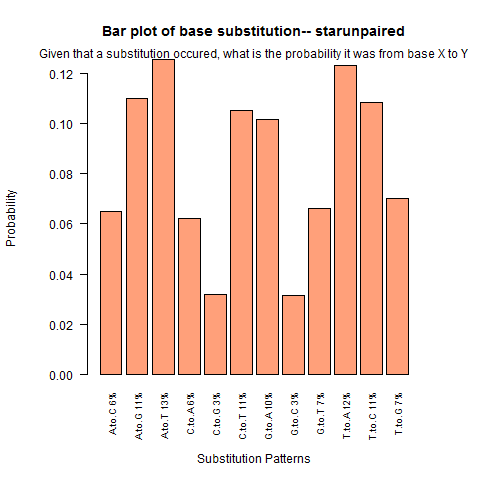
- Of all 12 non-self transitioning substitutions, there was a noticeable enrichment for T-to-C and depletion of G-to-A substitutions for mirtrons (and even tailed-mirtrons) than compared to intergenic and intronic miRNAs. Such trend was less noticeable for the other 10 substitution patterns.
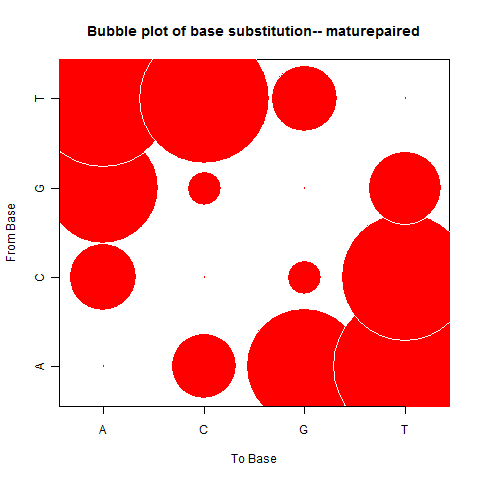
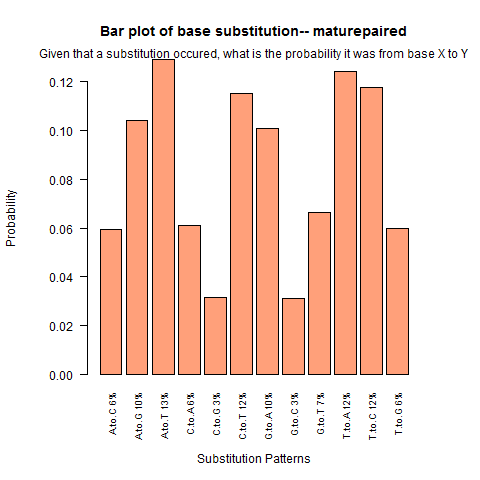
- When I examine these two substitutions patterns for each miRNA hairpin partition (second link), I saw that in general the stem regions (i.e. paired, maturepaired, matureunpaired, starpaired, starunpaired) have concordant increase of T-to-C and decrease in G-to-A substitutions for mirtrons contrasted with intergenic and intronic miRNAs. These patterns do not appear true in the loop or unpaired regions outside the duplex.
- I'm not quite sure how to accurately explain this pattern but here is my take on why this may be. Let me first say that I've seen on some websites, though no journal articles, that the stability/strength of the base pairing free-energy decreases in the following manner: GC > AU > GU pairs. Therefore, G-to-A and T-to-C substitutions at paired sites which preserve pairing would, in general, strengthen the stability of the hairpin, however T-to-C substitutions would do so quicker or more effectively than G-to-A substitutions, because the number of hydrogen bonds increases. One reason why mirtrons hairpin structures seem to arise and fixate so quickly might be due to specific substitution preference like the ones that produce stronger structures quicker.
- Moreover, when looking at the substitution analysis with all miRNAs but only including hairpin orthologs (see plot), this nucleotide trend disappears from the mirtron. It suggests that once the hairpin sturcture is achieved, there is no further evolutionary pressure to strengthen it.
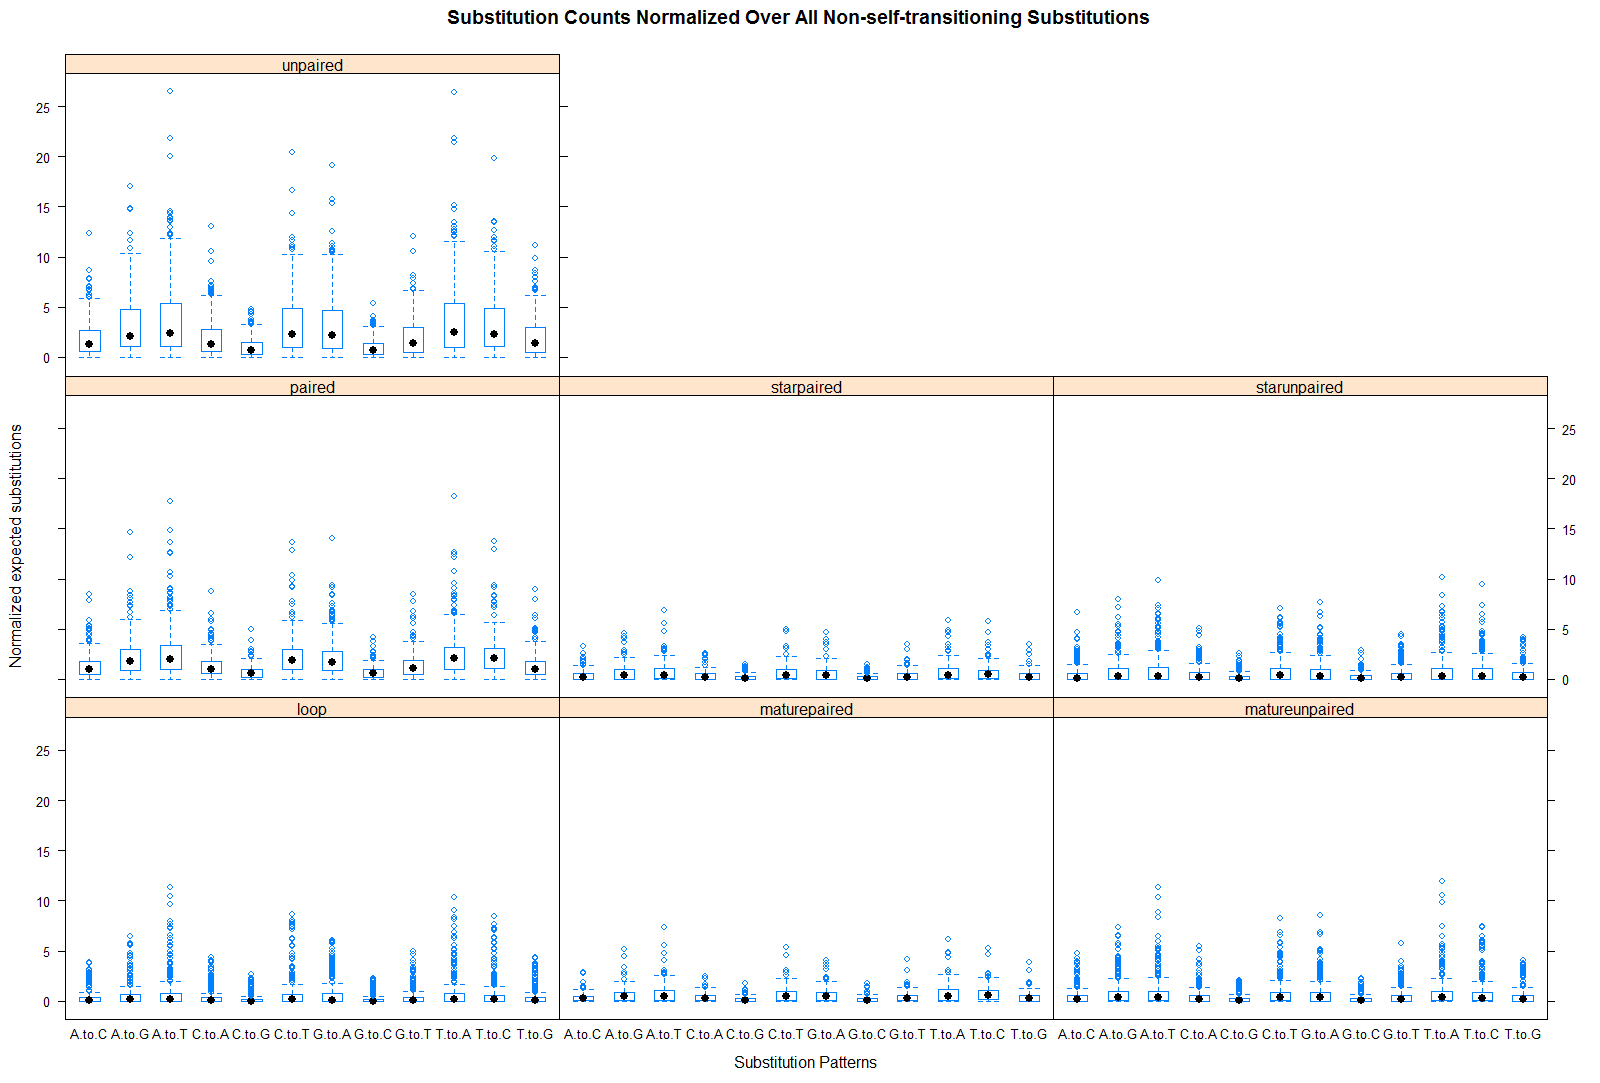
- Next, when surveying substitution patterns across of the loop compared to the other partitions of the hairpin structure, I saw patterns where there were an overall increase or decrease in substitution rate. The stem showed enrichment in T-to-A, G-to-A, and A-to-T substitutions compared to the loop, whereas, the loop showed preferential substitutions of C-to-G, A-to-C, A-to-G, T-to-C, T-to-G, G-to-C, and C-to-A substitutions. Except for T-to-C substitutions, the unpaired regions outside the duplex show almost identical substitution patterns as the loop.
Other Auxiliary Plots
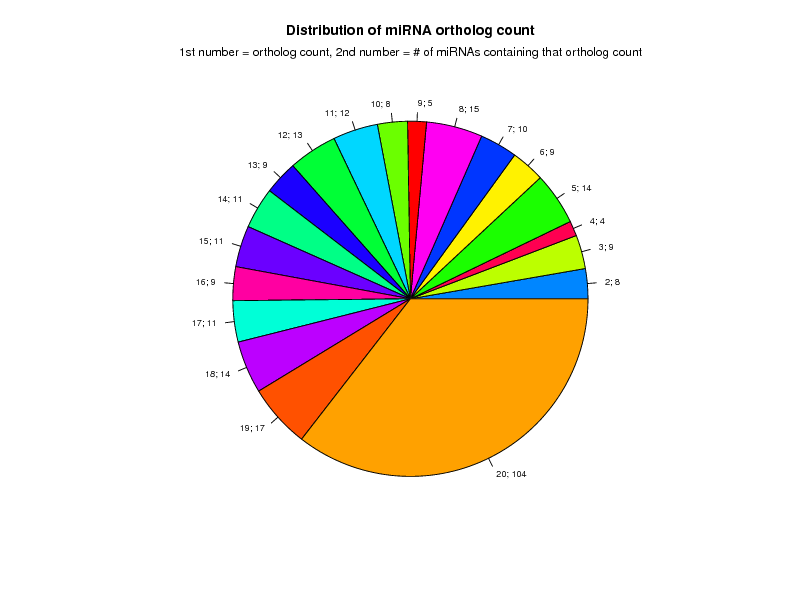
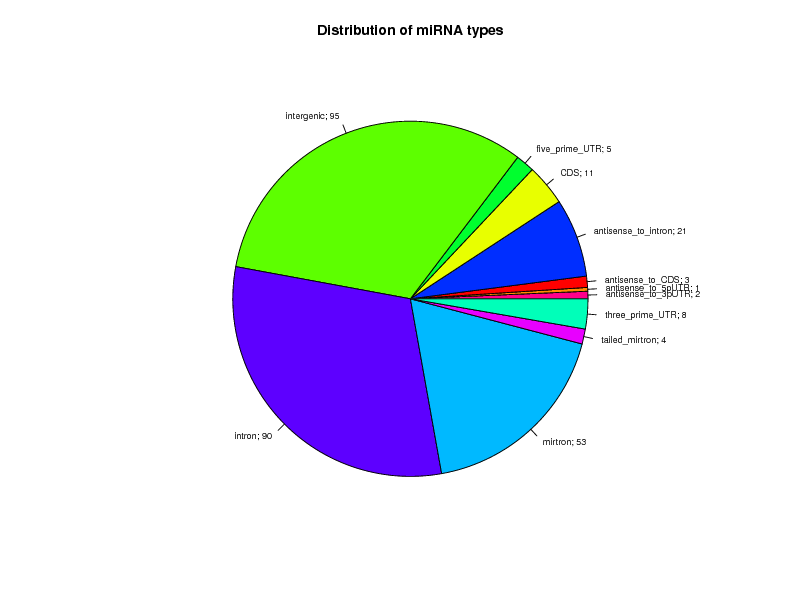
Here are some helpful plots to understand the amount of miRNAs contained in several of the slices of the data as described above:
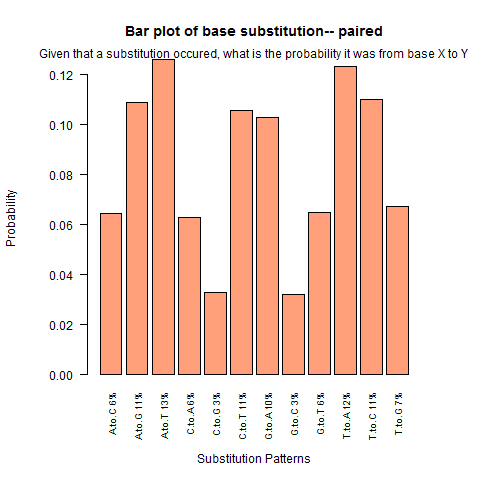
6/8/2011
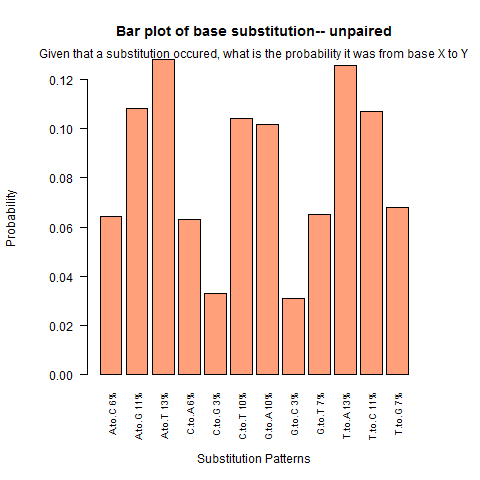
There is a significant anomaly in the substitution plots from 6/6/2011. In a nutshell, the from and to bases are reversed. For example, G.to.A. should actually be A.to.G. Here is the correct and consolidated plot:


6/6/2011
Deeper conservation investigation by slicing:
- Analysis with all confident orthologs present
- All miRNA confidence (candidate, novel and known_mirbase)
- Excluding candidate loci (only novel and known_mirbase)
- Analysis with only hairpin orthologs present
Distribution of miRNAs per miRNA type and Ortholog Count
All confident orthologs present


Only hairpin orthologs present
Deeper substitution investigation
Substitution patterns per miRNA class


4/8/2011
Conservation
| 12 fly species |
 |
| Only species where miRNA is present |
 |
Below plots are mostly redundant. However the first row shows the conservation analysis on the cumulative set of all miRNAs.
| |
Analysis with all 12 fly species from MAF |
Analysis after selecting only species where miRNA is present |
| All miRNAs |
 |
 |
| Only Known Mirbase miRNAs |
 |
 |
| Only Novel miRNAs |
 |
 |
| Only Candidate miRNAs |
 |
 |
Substitutions
| |
Analysis with all 12 fly species from MAF |
Analysis after selecting only species where miRNA is present |
| Loop |
|
|
| Paired outside duplex |

|
|
| Unpaired outside duplex |

|

|
| Mature Paired |
|
|
| Mature Unpaired |
|
|
| Star Paired |

|
|
| Star Unpaired |

|

|
Total expected substitutions (Normalized)
| 12 fly species |
 |
| Only species where miRNA is present |
 |