|
Method Overview
|
This website contains an overview of the INSIGHT method.
For more details on the probabilistic model and inference algorithm, see
(Gronau et al., Mol Biol Evol, 2013).
|
Introduction
Model
Data Analysis
|
|
|
Introduction
|
Method objective.
INSIGHT infers signatures of recent natural selection
from patterns of polymorphism and divergence across a collection of short dispersed genomic elements.
The core of the method is a full probabilistic model that allows it to make use of sequence data across
a dispersed set of elements to disentangle the effects of neutral genetic drift from
positive, strong negative,
and weak negative selection.
INSIGHT provides estimates of three main measures:
the fraction of nucleotides under selection (ρ),
the number of divergences driven by positive selection (Dp),
and the number of polymorphisms under weak negative selection (Pw).
|
Dispersed elements.
Individual elements should typically be fairly short, ranging from a single nucleotide to
perhaps a few hundred bases in length.
The method makes no prior assumptions on the genomic distribution of elements,
but the collection should be reasonably homogeneous and coherent.
Some examples are:
- The collection of all binding sites of a particular transcription factor.
- All binding sites near genes of a particular functional category.
- All noncoding RNAs of a particular type.
- All paired bases in a group of RNAs.
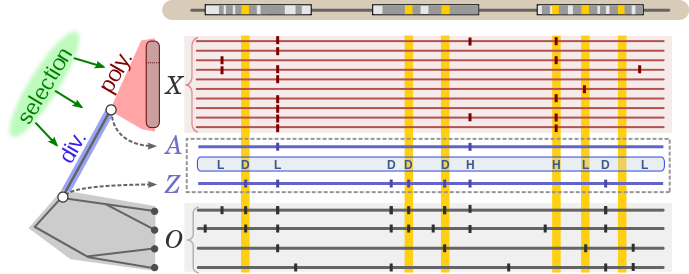
 Dispersed genomic elements.
Gold blocks represent elements of interest interspersed along the genome.
Dispersed genomic elements.
Gold blocks represent elements of interest interspersed along the genome.
|
|
Main features of the model.
-
Designed to characterize signatures of natural selection even in
recently evolved functional elements,
by analyzing patterns of polymorphism within a particular
target population (or species)
and patterns of divergence of that population from a recent ancestor.
-
Accounts for weak selection,
by using a simple representation of the site frequency spectrum
via two frequency categories, low and high, defined using a fixed threshold f (set by default to 0.15).
The simple representation also buffers the method from the subtle
influence of recent demographic changes on the site frequency spectrum.
-
Deals with the influence of demography
by directly contrasting patterns of polymorphism and divergence in the elements of interest to patterns
observed in nearby neutral sites.
-
Draws its statistical power by pooling weak information across a large number of
dispersed elements, while accounting for variation along the genome
in features such as mutation rate and coalescence time.
|
Polymorphism and divergence data.
The model assumes that genome-wide polymorphism data (X) is provided for a particular target population
in a form that allows polymorphic sites to be reliably
distinguished from invariant sites and provides reasonably accurate information about allele
frequencies (see below).
Divergence is inferred using the complete genome sequence of one or more closely related outgroup species.
While INSIGHT can be used with a single outgroup genome, better information about ancestral alleles
can be obtained by using additional outgroups (see below).
INSIGHT uses the population and outgroup sequence data to probabilistically label
each monomorphic site as being either non-dovergent (N)
or divergent (D),
and each polymorphic site as having either a
low-frequency derived allele (L),
or a high-frequency derived allele (H). The distinction between
low and high frequencies is made using a fixed threshold, f.
The probabilistic labeling of sites as N,D,L, or H,
depends on two ancestral sequences, which are treated by the INSIGHT model as
latent variables:
a deep ancestral sequence (Z), which determines whether monomorphic sites are divergent or not,
and a sequence of population ancestral alleles (A), which is used to determine the derived allele for each
polymorphic site. A probabilistic phylogenetic model is used to relate the observed sequence data (X and O)
with the latent ancestral sequences (A and Z), and sum over all possible assignments to the
latent variables.
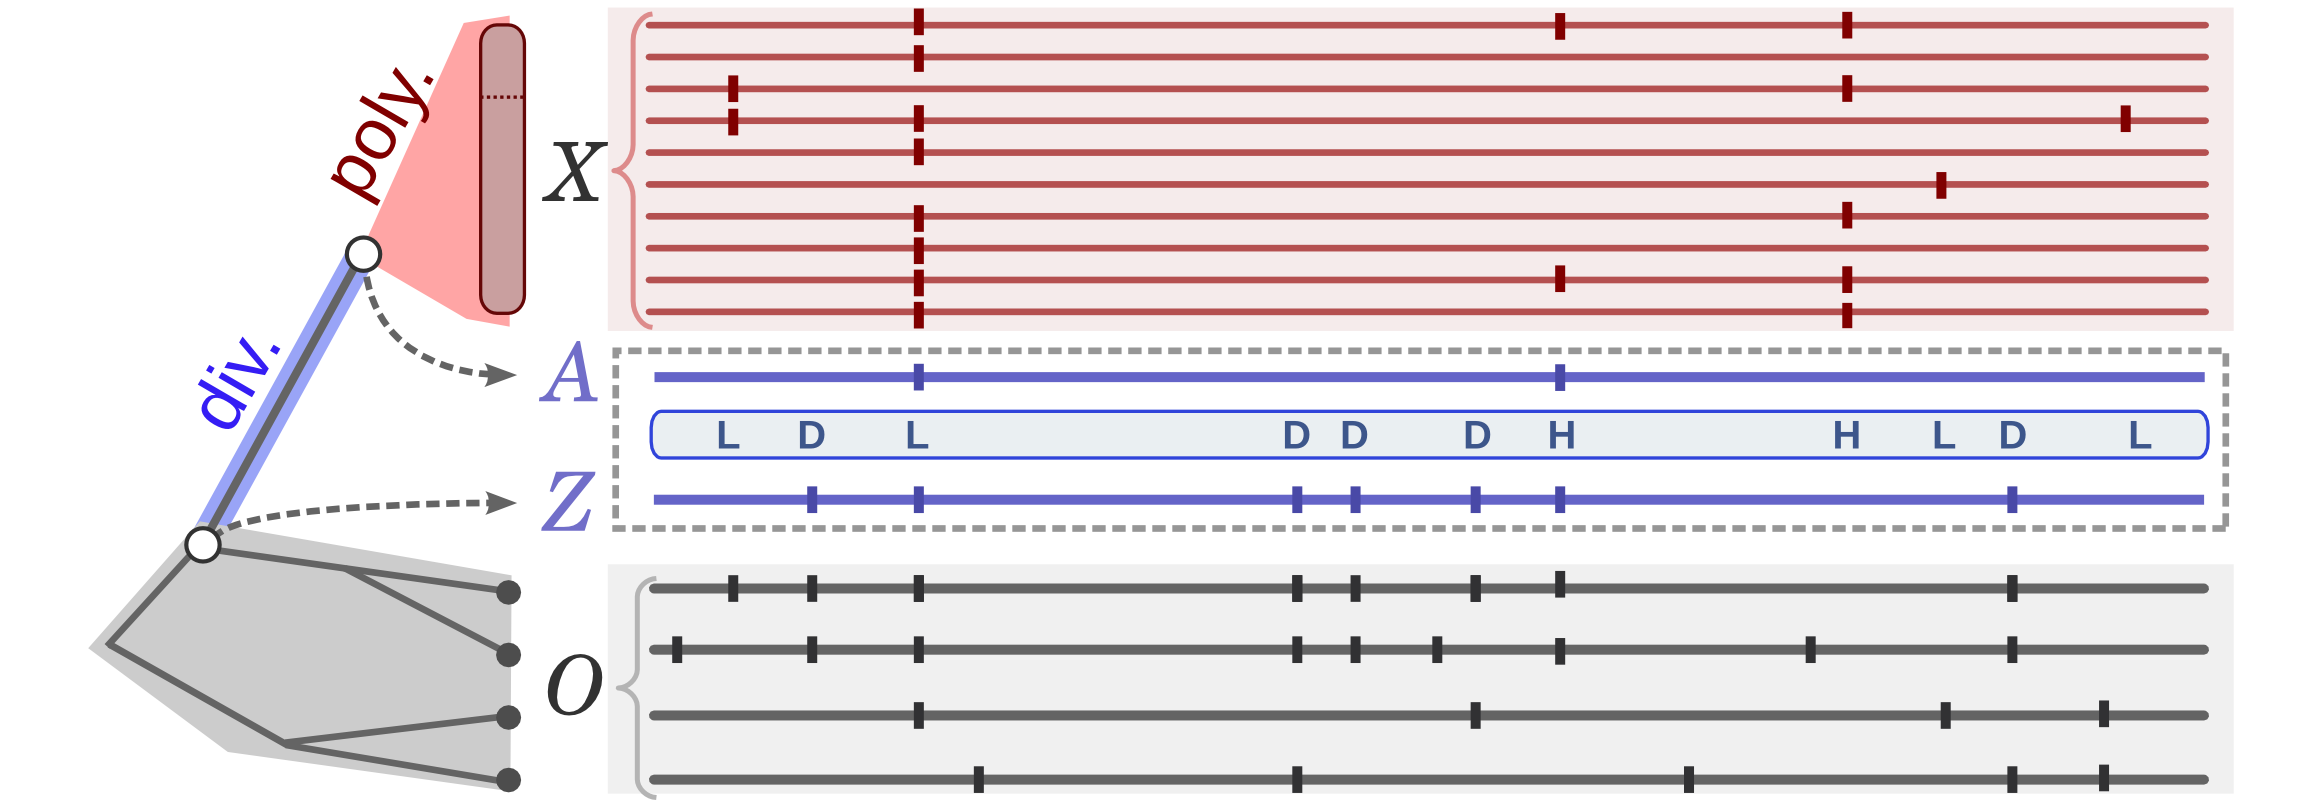 Polymorphism and divergence data.
Horizontal lines represent indiviudal genome sequences from the target population (X, red)
or outgroup species (O, gray),
with vertical ticks indicating single nucleotide variants relative to an arbitrary reference.
A phylogenetic model (left) is used to probabilistically infer a series of ancestral alleles
(A and Z), which imply a labeling of sites as N, D, L, or H.
This figure illustrates a likely assignment to the ansectral alleles and the implied labeling, in which
the N labels are omitted.
Polymorphism and divergence data.
Horizontal lines represent indiviudal genome sequences from the target population (X, red)
or outgroup species (O, gray),
with vertical ticks indicating single nucleotide variants relative to an arbitrary reference.
A phylogenetic model (left) is used to probabilistically infer a series of ancestral alleles
(A and Z), which imply a labeling of sites as N, D, L, or H.
This figure illustrates a likely assignment to the ansectral alleles and the implied labeling, in which
the N labels are omitted.
|
|
Model
Model for natural selection.
Each nucleotide site is assumed to evolve according to one of four
possible selective modes: neutral drift, strong negative selection,
weak negative selection, or positive selection.
The key to this categorization is the observation that these four selective modes make distinct contributions
to polymorphism and divergence, summarized as follows:
| monomorphic | polymorphic |
| N | D | L | H |
| neutral | + | + | + | + |
| strong negative | + | - | - | - |
| weak negative | + | - | + | - |
| positive | + | + | - | - |
|
The restrictions in this table are derived from the following three basic assumptions:
- Negative selection (either strong or weak) largely prohibits the eventual fixation of derived alleles.
- Strong negative and positive selection generally cause mutations to reach fixation or be lost rapidly,
and therefore will mostly eliminate observable polymorphisms.
- Weak negative selection allows polymorphisms to persist, but will tend to hold derived alleles at low frequencies.
As it turns out, it is impossible to infer the fraction of sites under each type of selection from counts of the four site
labels (N, D, L, and H), without making additional assumptions on the contribution of each
category to the number of monomorphic non-divergent sites (N).
INSIGHT addresses this problem by grouping the three categories of selected sites (positive, weak negative, and strong negative) into
a single category, and producing an estimate for the total fraction of sites under selection
(ρ). Information on the different modes of selection comes from estimates of
the number of divergences driven by positive selection (Dp),
and the number of polymorphisms under weak negative selection (Pw).
|
The probabilistic model.
The probabilistic model of INSIGHT contains the following parameters
in addition to the fraction of sites under selection (ρ):
- λ - the neutral rate of divergence between the ancestral genome (Z) and the target population.
- θ - the neutral rate of polymorphisms, represented by the population-scaled mutation rate.
- β - relative frequency of neutral polymorphic sites with low derived allele frequencies
among neutral polymorphisms.
- η - ratio of divergence rate at selected sites to neutral divergence rate.
- γ - ratio of polymorphism rate at selected sites to neutral polymorphism rate.
Parameters η and γ describe the influence of positive selection and weak negative selection (resp.)
on divergence and polymorphism rates. The value of η is driven upward by positive selection and downward by negative
selection, so that it might be less than or greater than 1. The value of γ is driven upward by weak negative selection
and downward by strong selection (negative and positive). While we do not expect γ to be greater than 1
(even under extreme cases of widespread weak selection), we do not restrict its value in inference.
These model parameters enable to model to express the expected frequencies of the four site labels
(N,D,L, and H) in neutral sites and sites under selection as follows:
| neutral | under selection |
| N |
(1-λ)(1-θ) |
(1-ηλ)(1-γθ) |
| D |
λ(1-θ) |
ηλ |
| L |
βθ |
(1-ηλ)γθ |
| H |
(1-β)θ |
0 |
|
Note: we use slightly simpler notations here compared to the ones used in
(Gronau et al., Mol Biol Evol, 2013):
θ, λ, and β correspond to θan, λt,
and β1 in the paper.
|
Pooling information across elements.
INSIGHT draws its inference from the difference between the frequencies of the four classes of sites
(N, D, L, and H) in the elements of interest and the frequencies observed in
nearby neutral site.
However, to conduct this comparison appropriately, the model has to integrate sparse information from a
large number of dispersed elements, while accounting for variation along the genome in mutation rates
and coalescence time.
This is achieved by grouping nucleotide sites in both elements and flanking neutral regions into fixed
genomic blocks, and associating each block (b) with a block-specific neutral polymorphism rate
(θb) and neutral divergence rate (λb).
Pooling information across elements.
The probabilistic model of INSIGHT (left) describes the frequencies of
the four classes of sites (N, D, L, and H)
within neutral sites and sites under selection.
INSIGHT detects natural selection in a collection of dispersed genomic elements (gold)
by comparing the frequencies of these four classes within elements to those within flanking neutral sites (dark gray).
Nucleotide sites in both elements and flanks are grouped into genomic blocks
(light gray boxes), each assumed to have its own neutral polymorphism rate and neutral divergence rate.
|
|
Data Analysis
|
Summary of population sequence data.
Based on the population sequence data (X), every genomic position is classified as monomorphic (M),
polymorphic with a low-frequency minor allele (L),
or polymorphic with a high-frequency minor allele (H). The frequency threshold f
is used to make the distinction between low and high frequencies, but this distinction is made based
on the frequency of the minor allele, rather than the
derived allele, which is probabilistically inferred using the model.
The observed alleles are recorded for each position, and sites with more than two observed alleles
within our population sample are discarded from the analysis.
Note that this summary of the data requires polymorphic sites to be reliably distinguished from invariant sites, as well as
reasonably accurate information about allele frequencies.
Currently, this is most easily
achieved using high-coverage individual genome sequences, although the
model could also be adapted to make use of statistically inferred genotype
frequencies based on low-coverage sequence data.
|
|
Summary of outgroup sequence data.
For each nucleotide position, i, we record a set of aligned bases from the outgroup genomes
(Oi).
The probabilistic model of INSIGHT assumes that all variables
(sequence variables Xi and Ai,
and the selection label Si)
are conditionally independent of Oi, given the deep ancestral allele,
Zi.
This implies that the outgroup sequence data can be summarized by computing, in pre-processing,
the prior distribution over then ancestral alleles, P(Zi|Oi).
This pre-processing stage can be carried out using standard statistical phylogenetic software, such as
RPHAST.
|
The inference method.
After inferring genome-wide prior probabilities for the deep ancestral states, Zi,
a second pre-processing step is applied to compute for each genomic block, b, its neutral
divergence rate parameter (λb) and neutral polymorphism rate parameter
(θb), as well as the (global) relative rate of low-frequency neutral
polymorphisms (β).
Once the ancestral priors and neutral parameters are estimated,
an EM algorithm (INSIGHT-EM) is used to infer the three selection parameters, ρ, η, and γ.
The parameters are then used to derive the expected number of divergences driven by positive selection
(Dp) and the expected number of polymorphism under weak selection (Pw).
Note: the two preprocessing steps (computing the ancestral priors and neutral parameter estiamtes)
do not depend on the specific collection of elements being analyzed, and can thus be applied a single time
genome-wide, with their results being stored for numerous subsequent applications of INSIGHT-EM.
|
|
|
|